By Dr. Colin Ferster
We’re celebrating a recently published BikeMaps.org paper about data quality. Specifically, it addresses demographic representation. BikeMaps.org helps to fill an important hole in cycling safety – the majority of bicycle crashes are not reported in hospital or insurance records, and there is no official mechanism for reporting near misses (see Winters & Branion-Calles, 2017). Crowdsourcing is a great approach to provide data that are not otherwise available. For example, BikeMaps.org may be the only information about incidents that don’t involve collisions with cars or hospitalization, so it provides important information to planners to make cycling safer, more comfortable, and more appealing to all. One concern that is often voiced about crowdsourcing is representation. The people who contribute to crowdsourcing projects are self-selected, unlike, for example, car crashes, which are nearly all are reported in insurance claims (cars are expensive!). Cycling should be safe and enjoyable for “all ages and abilities”. We set out to learn who is reporting, who is not reporting, and what are the implications?
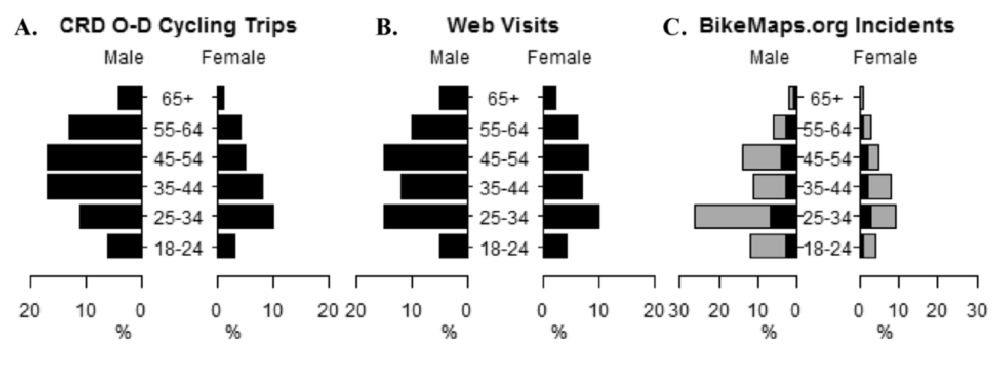
In the paper, we compared age and gender for people riding bicycles in the Capital Regional District (CRD) with people who use BikeMaps.org, and then we compared maps of the reported incidents. To find out who was riding bicycles in the CRD, we used data from an origin-destination survey. We used data from Google Analytics to find out about who was viewing the webpage. Finally, we used the optional demographic information from BikeMaps.org incident reports (provided for more than 60% of the reports).
The CRD is unique in that there are more older people riding bicycles than in many other similar studies (which is great!!). We found out that there were significantly more reports on BikeMaps.org by males aged 25-34 years old. This is not surprising – this demographic is a frequent participant in other web mapping projects (like OpenStreetMap – see Stephens, 2013), and they are also a common group in serious bike crashes with injuries (Knowles et al., 2009).
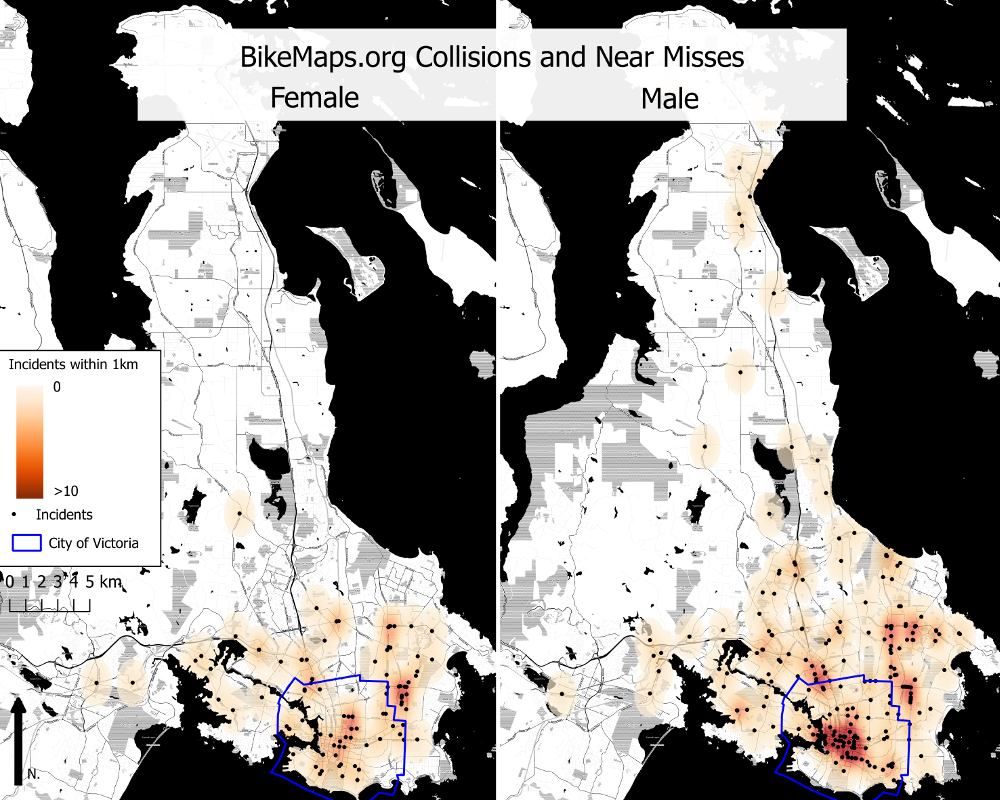
Next we set out to see what are the implications by comparing maps by age and gender. We found out that younger people and females mapped more incidents in the city core, while older people mapped more incidents outside the city core. The same high priority hotspots were visible across the maps, yet there were more nuanced differences to consider when moving beyond the main hotspots. Understanding these aid in interpretation of the data. Females will benefit from the infrastructure improvements in the city core. Older bicyclists will benefit from improvements to the access points for multi-use trails. With better infrastructure, we expect riding bicycles in the city core will be more accessible to older people. In other words, the incidents mapped by the most common demographics (males age 25-34) were a good indicator for the main concerns for the other groups too, but it is still important to consider the experiences of the other groups to get the complete story.
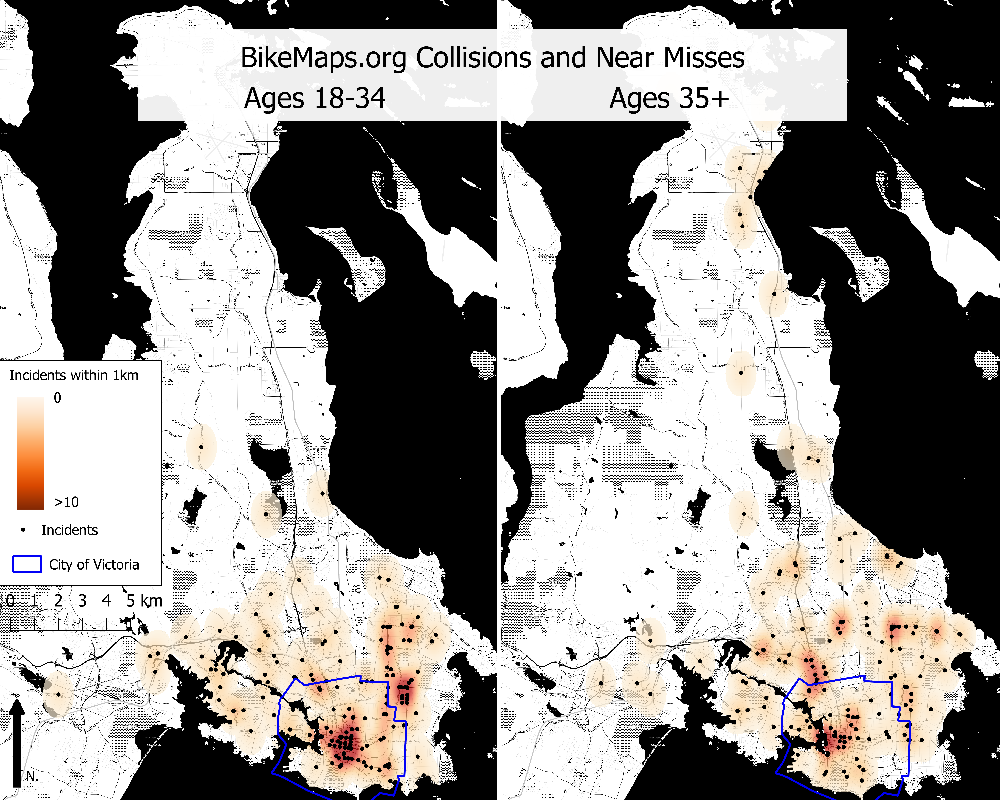 Base map tiles by Stamen Design, under Creative Commons 3.0 License. Data by OpenStreetMap contributors, under Open Database License.
 Base map tiles by Stamen Design, under Creative Commons 3.0 License. Data by OpenStreetMap contributors, under Open Database License.
Reflections
We found that most of the reports on BikeMaps.org were by young-adult males, and that these points are good indicators for the main places that need attention for other groups too. We seek out representation of other groups because diversity is enriching, and it helps us learn more about a wide range of experiences. Basically, the more people that use BikeMaps.org the better. All of the points mapped provide records of bicycling experiences that city planners and other bicyclists can learn from; in the past almost of these incidents would not have been recorded at all! If you are a member of the 25-34 male demographic sharing your experiences is helpful for other groups too. If you are not a member of this group, also thank you for contributing, we definitely want to hear from you. Finally, age and gender are only a start for representation, but it something that we can measure and reflect on. Riding a bicycle should be safe and enjoyable for everyone in our cities.
References
Ferster, C. J., Nelson, T., Winters, M., & Laberee, K. (2017). Geographic age and gender representation in volunteered cycling safety data: A case study of BikeMaps.org. Applied Geography, 88(September), 144–150. http://doi.org/10.1016/j.apgeog.2017.09.007
Ferster, C., Nelson, T., Laberee, K., Vanlaar, W., & Winters, M. (2017). Promoting Crowdsourcing for Urban Research : Cycling Safety Citizen Science in Four Cities. Urban Science, 1(2), 1–17. http://doi.org/10.3390/urbansci1020021
Knowles, J., Adams, S., Cuerden, R., Savill, T., Reid, S., & Tight, M. (2009). Collisions involving pedal cyclists on Britains roads-establishing the causes (TRL Report). Transport Research Laboratory, Department for Transport, United Kingdom.
Romanillos, G., Zaltz Austwick, M., Ettema, D., & De Kruijf, J. (2015). Big Data and Cycling. Transport Reviews, 1647(January), 1–20. http://doi.org/10.1080/01441647.2015.1084067
Stephens, M. (2013). Gender and the GeoWeb: Divisions in the production of user-generated cartographic information. GeoJournal, 78(6), 981–996. http://doi.org/10.1007/s10708-013-9492-z
Winters, M., & Branion-Calles, M. (2017). Cycling Safety: Quantifying the underreporting of cycling incidents. Journal of Transport & Health, 1–6. http://doi.org//10.1016/j.jth.2017.02.010

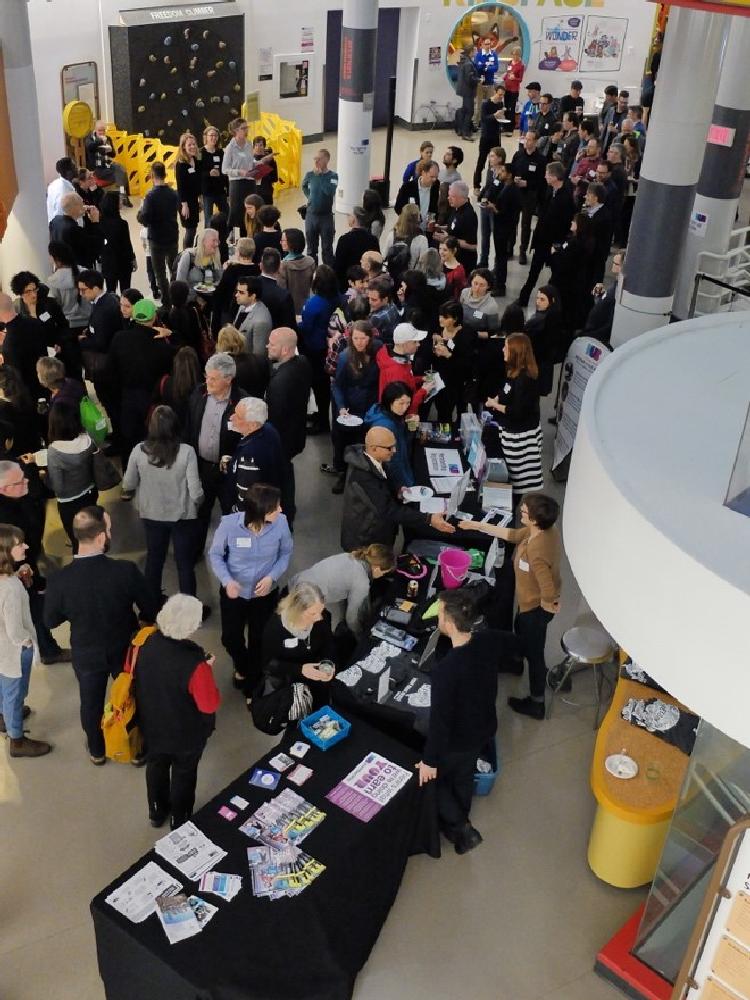 Photo credit: Ken Ohrn
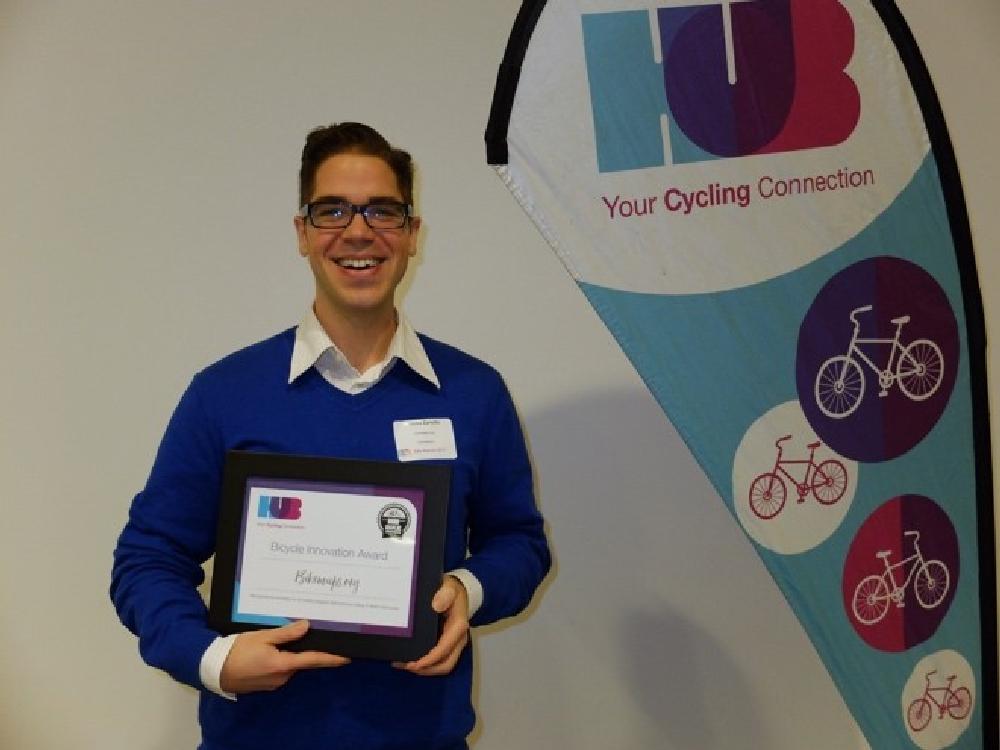 Photo credit: Ken Ohrn
_07_18_16.JPG)