BikeMaps.org
  • Home
  • Visualization
  • Blog
  • About
  • Español
  • Français
  • Íslenska
  • Guest
    • Log in
    • Register

BikeMaps Blog

  • Apr 22

    City of Vancouver Doorings: Caution-Zones Map

    Apr 22
    Tweet

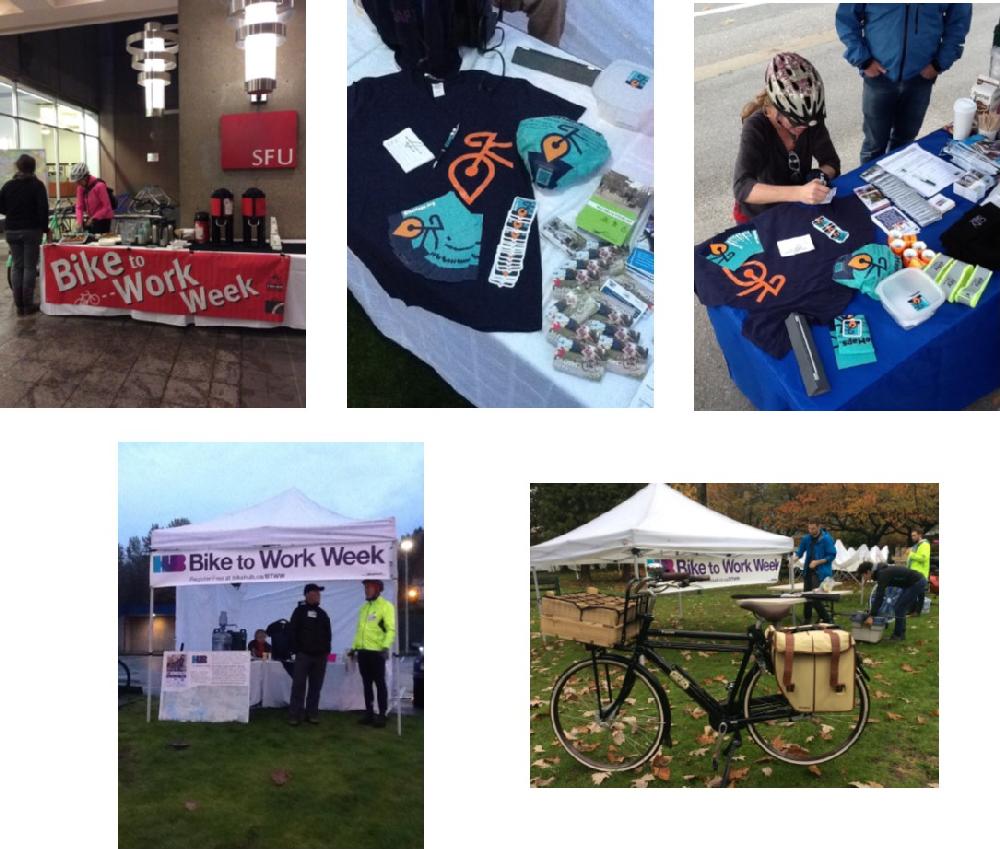
    BikeMaps.org helps to make cycling safer by providing municipalities, the Province and other stakeholders with a supplementary database on cycling incidents. These citizen reports help transportation planners and engineers determine where upgraded (or new) cycling facilities are needed. More robust cycling incident data is the first step toward safer streets.

    In addition to assisting municipalities with planning safer streets, BikeMaps.org can provide cyclists with the latest information on safety hot-spots. We’ve compiled collision data from ICBC and BikeMaps.org to develop a list of dooring caution zones in the City of Vancouver. Doorings were the most prevalent type of cycling collision reported through official reports (Urban Systems, 2015). In the five dooring incidents reported to BikeMaps.org, three of the five cyclists were injured, and two sustained injuries serious enough to require an emergency department visit or overnight hospital stay.

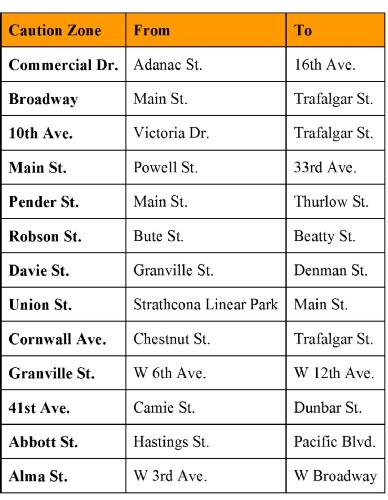
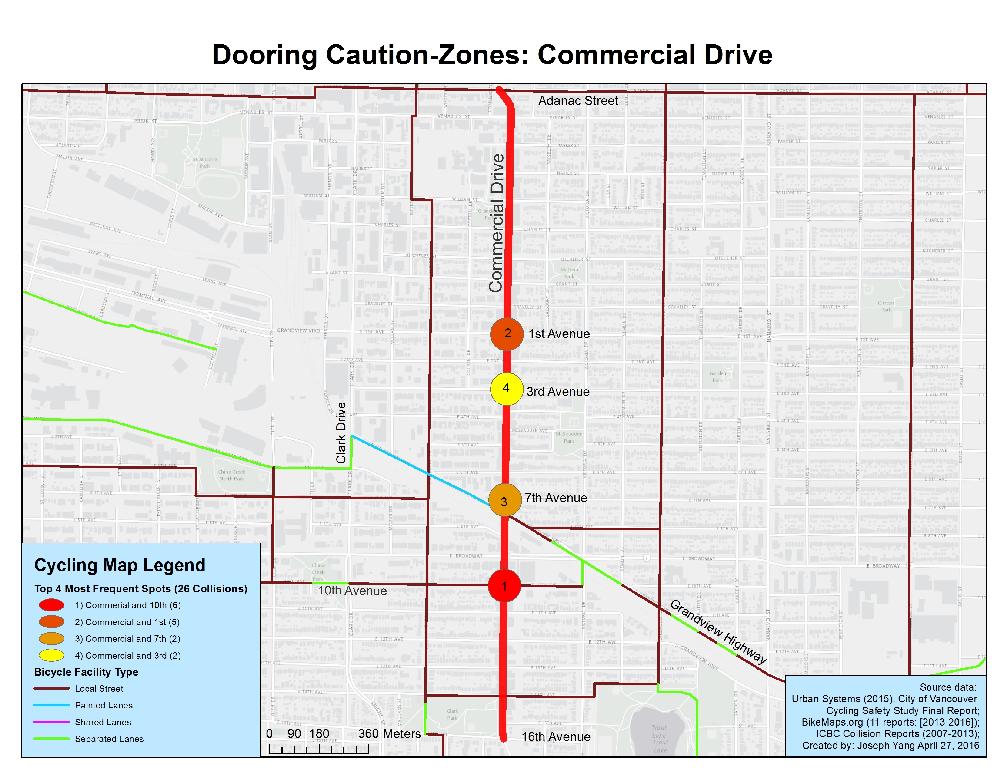
    Have a look at the dooring caution-zones map and accompanying table of dooring caution-zones. If you cycle in these zones, be sure to keep adequate space from parked cars, or use a nearby designated cycling facility. A map of Vancouver’s cycle routes is available here.

    Corridor upgrades like the one proposed by Streets For Everyone for Commercial Drive may significantly reduce or eliminate this type of cycling collision. Email the City of Vancouver Mayor and Council and the Drive Business Improvement Association (BIA) your thoughts about making the Drive a complete street! Let’s see if we can get Commercial Drive off this map! Dooring map yvr

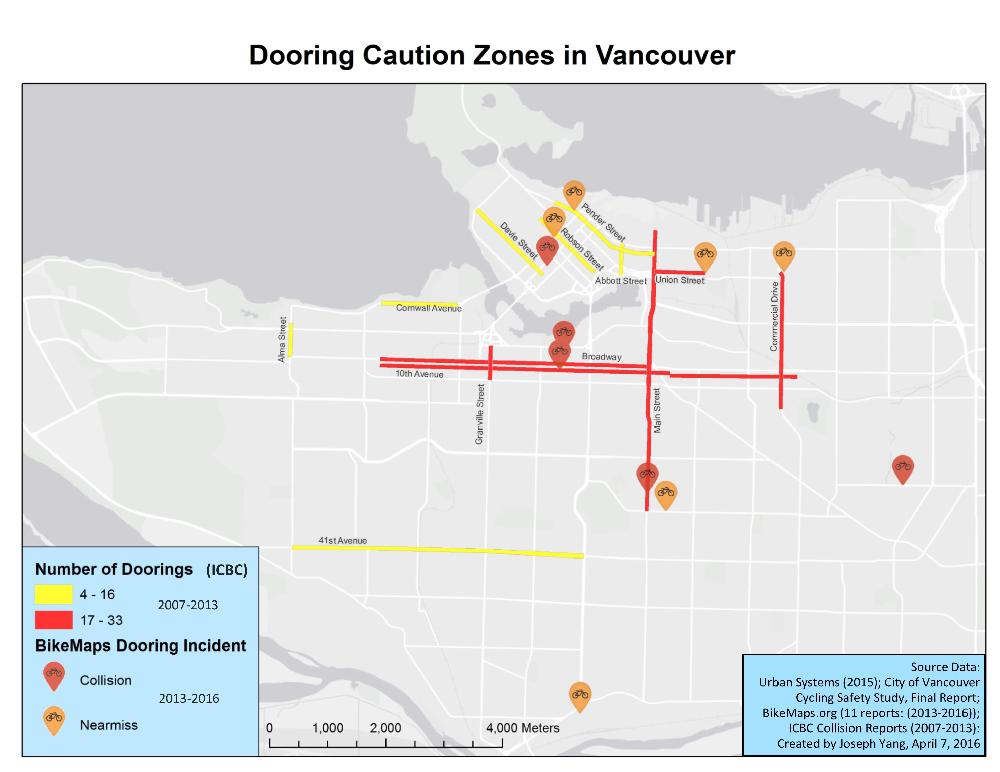
    Dooring Caution-Zones in Vancouver Dooring table

    commercial

    Reference: Urban Systems. 2015. City of Vancouver Cycling Safety Study Final Report.

  • Feb 11

    Active Living Research - Review of Active Transportation Research and Policies

    Feb 11
    Tweet

    Active Living Research ALR is an interdisciplinary team with internationally recognized expertise in public health, transportation, planning, parks and recreation, school activity programs, behavioral science, and obesity prevention. ALR has recently released a research review, summarizing current knowledge on the health benefits and safety of active travel titled Moving Toward Active Transportation: How Policies Can Encourage Walking and Bicycling. BikeMaps.org researcher Dr. Meghan Winters was part of the ALR team that prepared the review, which also examined policies and programs that can help to increase walking and biking rates.

    The main findings include:

    • A growing number of recent studies have confirmed health benefits specifically for walking and cycling.

    • The health benefits of active transportation exceed its risks of injury and exposure to air pollution.

    • Safety is a key consideration for promoting active travel. Importantly, places with higher levels of walking and cycling also have greater safety for pedestrians.

    • Provision of convenient, safe, and connected walking and cycling infrastructure is at the core of promoting active travel.

    • Aside from specific infrastructure for cyclists and pedestrians, the way neighborhoods and communities are built affects levels of active travel.

    • Walking or biking for daily travel needs can be promoted as a convenient and competitive option through programs that shift travel behavior.

    • Policies that improve public transport, or make car use less attractive, increase the competitiveness of active travel modes.

    • Policies to promote active travel will work best when implemented in comprehensive packages; these may include infrastructure and facility improvements, pricing policies, and education programs to achieve substantial shifts towards active modes. foggyfall

  • Jan 22

    Updates to the Hazard Mapping Function

    Jan 22
    Tweet

    After a year of BikeMappers pinning hazards, it became apparent that we needed to tweak some of our hazard mapping. Far too many hazards were being categorized as “other”. Combing through the detailed descriptions, we created new categories that better reflect the hazards that people were actually concerned about. We also removed the human behaviour hazard group. The rationale behind this was that any of these hazards were not persistent and therefore would do no good warning other cyclists. Further, hazards pinned under human behaviour categories could often be more accurately pinned as a near miss. We have also enabled certain hazards, such as icy roads or leaves on road, to disappear after a certain time period.

    For our research we do not analyze any of the hazards that are pinned. We provide the hazard mapping as a service to our citizen science reporters. It is important that the distinction between near misses and hazards be made. If you’ve had a collision, fall, or near miss from a hazard, logging it as a collision or near miss will enable us to analyze the environmental and infrastructure characteristics that possibly contributed to the incident. hazard v nearm

    Our hazard mapping is quite a popular feature of BikeMaps.org. Cyclists who have turned on the alert feature for their riding area will receive notifications of new hazards pinned in their area. Municipalities can also choose to monitor their geographical area for new hazards. This is especially useful for smaller cities that do not have a 3-1-1 system in place.

    Here is the list of all the hazards to choose from:

    Hazard list

  • Jan 4

    BikeMaps.org Promotion in MetroVan

    Jan 4
    Tweet

    This fall marked the expansion of BikeMaps.org to Metro Vancouver, a region home to almost 2.5 million people. As BikeMaps.org was relatively new to the region, our first step toward improving cycling safety was getting more cycling incidents reported on the website. To do this, we needed to raise awareness of BikeMaps amongst regional cyclists. With funding from the Bullitt Foundation, we focused on two main promotional events: a bike saddle cover drive and information tables at Bike to Work Week (BTWW) celebration stations. These events helped to increase the average daily reporting frequency by nearly 300 per cent (from 0.8 reports/day to 2.3 reports/day). As of December 2015, citizens reported over 520 cycling related incidents in Metro Vancouver, propelling us to 75% of our reporting target. The success of these initiatives helped us complete a cycling safety analysis of Vancouver’s 10th Ave. corridor. As more cyclists learn about BikeMaps.org and incident reporting continues to grow, BikeMaps.org is well positioned to make a valuable contribution to cycling safety in the region. MetroVan logo

    On October 23, a five-person team of BikeMaps volunteers, together with a Bullitt cargo bicycle loaded with over 600 brightly coloured BikeMaps.org saddle covers, travelled a 5.7 km route in Downtown Vancouver outfitting the saddles of parked bicycles with covers. Cyclists were encouraged to take a photo of their new saddle cover and uploaded the photo to Instagram for a chance to win a prize.

    Saddle collage

    The MetroVan BikeMaps team attended 10 Bike to Work Week (BTWW) celebration stations during the week of October 26-30, 2015. Stations were scheduled in the morning (07-09:00) and afternoon (16-18:00) peak periods in municipalities across the region. To encourage cyclists to visit our table, we included a prize draw for BikeMaps.org T-Shirts (daily), and one 100$ gift card. We engaged directly with 250-300 individuals over the course of BTWW, which enabled us to introduce BikeMaps.org, answer questions, and give demonstrations on how to report incidents.

    BTWW collage

  • Dec 21

    2000 Pins on BikeMaps.org

    Dec 21
    Tweet

    Citizens have mapped over 2000 cycling incidents on BikeMaps.org. Launched just over a year ago, BikeMaps.org has already created a substantive new source of data on cycling safety, especially in locations like Victoria (>750) and Vancouver (>500) where the research team has focused outreach efforts. Incidents have been mapped in 30 countries including across Canada, the United States, Australia, Germany, and the Netherlands. 21% of data are collisions; 39% of data are near misses; 31% hazards, and 9% thefts.

    Some facts from our analysis of the Victoria data.

    • 9.1 % of collisions include multiple bikes and 86% of these resulted in injury.

    • When the road is dry, 74% of reports are near misses. When it is wet, near misses drop to 51%.

    • The #1 cause of collisions and near misses: people who are driving vehicles turning right, cutting off the person riding a bike who is continuing straight.

    • Other common incident causes include: vehicles passing bikes too closely (including cyclists hit by mirrors), vehicles failing to stop, and vehicles turning left.

      cookies yyj collision word cloud

« Newer posts Older posts »